Dec 21, 2020
Larry Berman: Valuation for U.S. large caps has never been higher
By Larry Berman
Larry Berman takes your questions
VIDEO SIGN OUT
Historically, the last show of the year I do my fearless forecast for the coming year. This year, it is a bleak from a pure valuation perspective. But from a liquidity perspective, it’s up, up, and away.
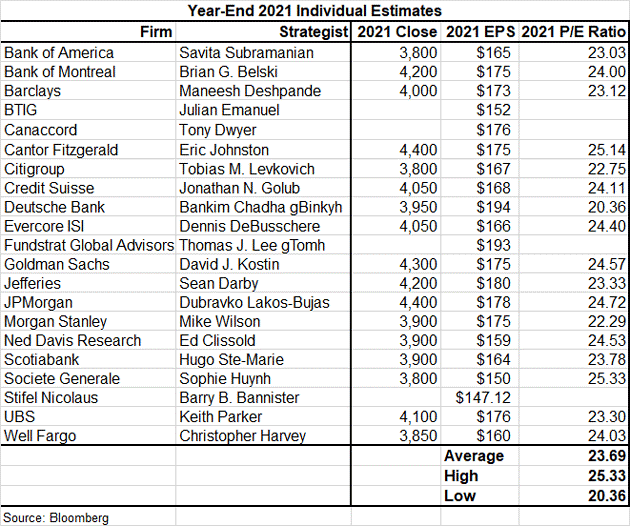
Our first table shows the Street has an average 23.69 multiple on 172.50 gives you an average S&P 500 target of 4085 for yearend 2021. JP Morgan is the high at 4,400 with several at the low of 3,800. The historic average is 16.5 and even if we account for the cheap cost of money and call it a 20x fair value multiple, we struggle to get to 3,500. The market closed last week above 3,700.
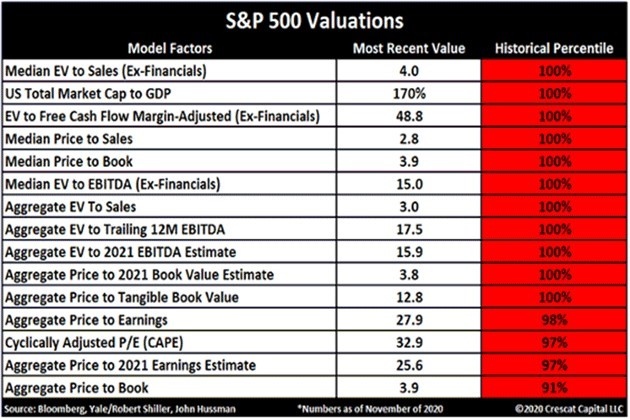
The next indicator in our PRO-II (Pro-Eyes) series looks at valuations today compared to history. There are many ways to look at valuation. My favourite is enterprise value to EBITDA. Enterprise value is the amount of capital the company has issued (debt plus equity less cash equivalents.) EBITDA is the earnings a company generates before interest and taxes are paid adjusting for non-cash items like depreciation and amortization. A measure like free cash flow that works for some industries better than others. Think about it this way: How much capital is at risk to generate free cash that the company can use to pay dividends or invest. We saw a valuation statistic table last week (shared below) that shows no matter how you measure U.S. large caps, they are the most expensive they have ever been.
Jerome Powell, chairman of the U.S. Federal Reserve, was asked in the Q&A last week about valuation. He chimed in with the same thing we’ve been hearing from Wall Street: Interest rates are low, there is no alternative, the multiple should be higher. This behaviour by central banks and investors have made the US equity market more expensive than it’s ever been. History tells us this is not a good time to own stocks. But indicators like this are never good a timing sell signals, they just warn that timing is not ideal for buyers. And future returns on average will be well below historic averages. Everyone knows this, but few pay much attention.
Crescat Capital put together this table looking at many ways of valuing U.S. large caps. Maybe it can go higher off the central bank printing press, but the slightest policy mistake reminds us that a correction can be significant. The degree of moral hazard priced into the equity market is colossal. There is no debate here.
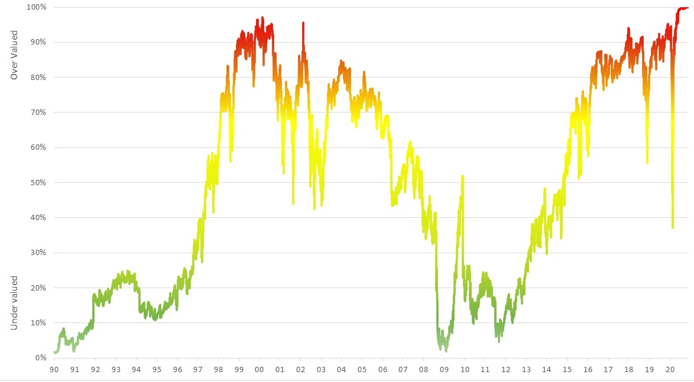
We have plotted EV to EBITDA on a trailing basis for the broad S&P 500 covering the past 30 years and three recessions. You can see the extreme nature of valuation over time. I have been concerned about valuations for several years, since Brexit in 2016, actually. We have had several violent corrections since then. The central bank printing press has brought the market back each time (the central banks call this financial conditions—read that as the S&P 500).
Enterprise Value to EBITDA Trailing 12M
Look for more in the coming weeks from our new Berman’s Call Probable Return on Investment Index, PRO-II (pronounced Pro Eyes) Indicator. We will be launching the new website in early January so that BNN Bloomberg viewers can follow along with the various risk and opportunity factors we follow.
Happy holidays and have a safe and happy new year. Will see everyone in 2021 — the year of well being!
Subscribe to my new YouTube channel LarryBermanOfficial which is the new site for all our educational content and my new weekly market recap and ETF bull and bear picks of the week. Look for a series of option based educational videos in 2021.
Follow Larry:
YouTube: LarryBermanOfficial
Twitter: @LarryBermanETF
Facebook: @LarryBermanETF
LinkedIn: LarryBerman
www.etfcm.com


